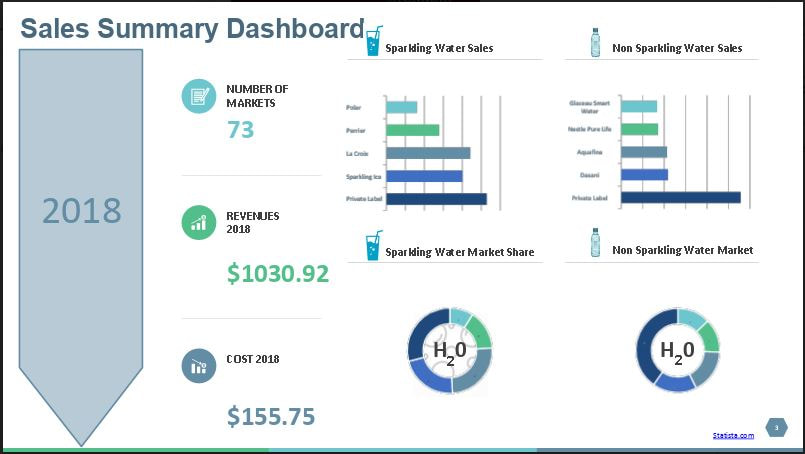
Source
Data pulled from Statista.com and infographic created in PowerPoint with data in Excel worksheets.
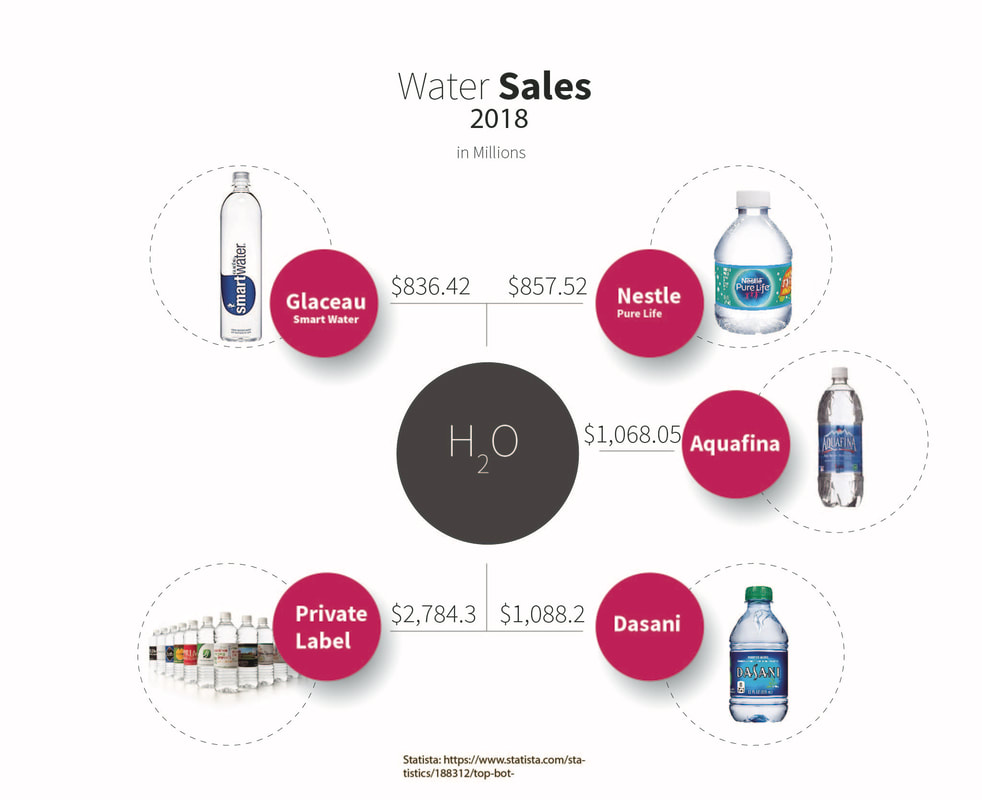
Source
Created in Adobe Illustrator with statistics from Statista.com.
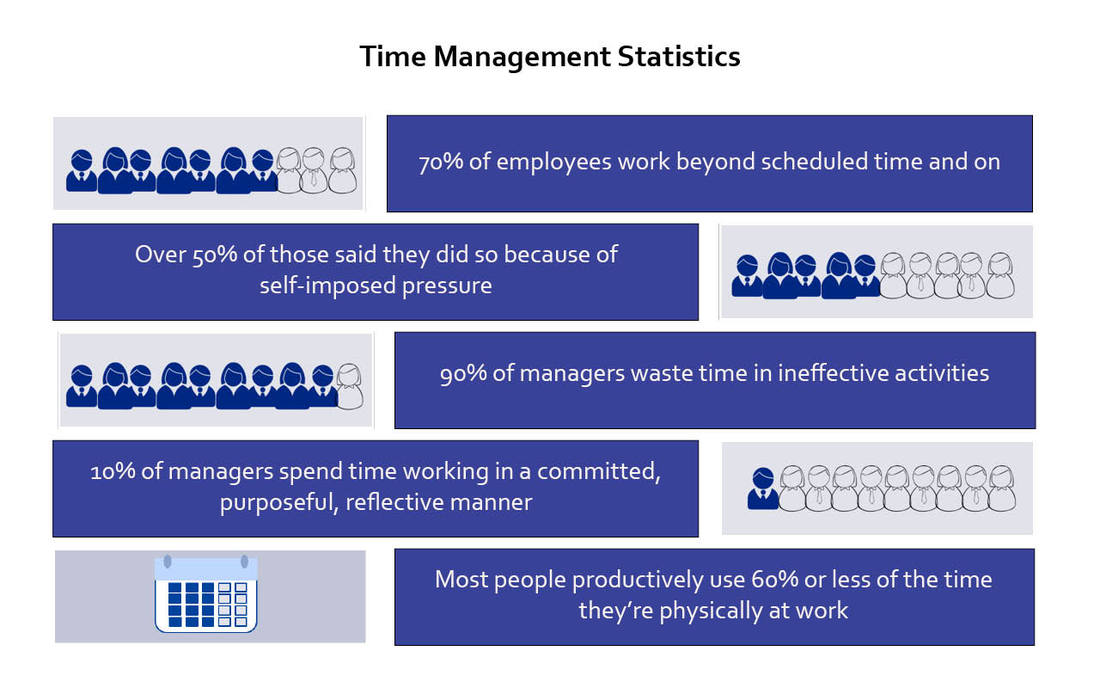
Source
This infographic was created in Adobe InDesign CC with a simple blank page, rectangles and text added. The images were created in PowerPoint from basic shapes and placed in the InDesign file which was then exported as .jpg. Adapted from Training Facilitation, Paula O'Brien, 2017. Data drawn from:
- Dr. Helke Bruch and Dr. Sumantra Ghoshal, Harvard Business Review, 2/2002
- Microsoft Survey, March 15, 2005
- Society for Human Resource Management, Spring 2009
Coffee To Go
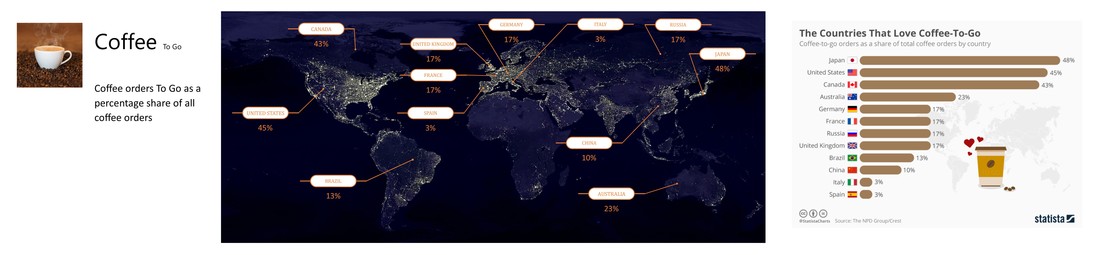
Source
This image, created in MS Publisher 2016, depicts coffee orders "to go" as a percentage of all coffee orders by country. The chart on the far right containing base data was downloaded from statista.com. The coffee cup and map images were downloaded from pexels.com. With the source materials captured, I created the layout and added callouts to complete the infographic.